Unit 2 Kinetics
2.4 Temperature and Reaction Rate
OpenStax
Section Learning Objectives
- Use the postulates of collision theory to explain the effects of physical state, temperature, and concentration on reaction rates.
- Define half-life for first-order reactions and carry out related calculations.
- Use the Arrhenius equation in calculations relating rate constants to temperature.
✓ SECTION 2.4 CHECKLIST
| Learning Activity | Graded? | Estimated Time |
|---|---|---|
| Make notes about this section’s reading portion. | No | 90 min |
| Optional Resource: Use the Arrhenius equation calculator to solve problems. | No | 45 min |
| Optional Activity: Play the PhET Reactions & Rates interactive. | No | 45 min |
| Work on the self-check question. | No | 15 min |
| Work on practice exercises. | No | 120 min |
📖 READING PORTION
Collision Theory
We should not be surprised that atoms, molecules, or ions must collide before they can react with each other. Atoms must be close together to form chemical bonds. This simple premise is the basis for a very powerful theory that explains many observations regarding chemical kinetics, including factors affecting reaction rates.
Collision theory is based on the following postulates:
- The rate of a reaction is proportional to the rate of reactant collisions
reaction rate ∝ #collisions/time
- The reacting species must collide in an orientation that allows contact between the atoms that will become bonded together in the product.
- The collision must occur with adequate energy to permit mutual penetration of the reacting species’ valence shells so that the electrons can rearrange and form new bonds (and new chemical species).
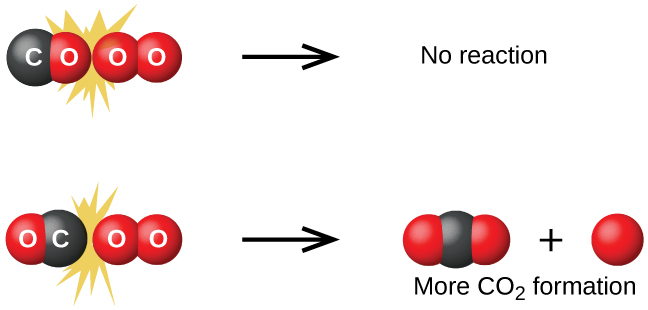
We can see the importance of the two physical factors noted in postulates 2 and 3, the orientation and energy of collisions, when we consider the reaction of carbon monoxide with oxygen
2 CO(g) + O2(g) ⟶ 2 CO2(g)
Carbon monoxide is a pollutant produced by the combustion of hydrocarbon fuels. To reduce this pollutant, automobiles have catalytic converters that use a catalyst to carry out this reaction. It is also a side reaction of the combustion of gunpowder that results in muzzle flash for many firearms. If carbon monoxide and oxygen are present in sufficient amounts, the reaction will occur at high temperature and pressure.
The first step in the gas-phase reaction between carbon monoxide and oxygen is a collision between the two molecules
CO(g) + O2(g) ⟶ CO2(g) + O(g)
Although there are many different possible orientations the two molecules can have relative to each other, consider the two presented in Figure 1. In the first case, the oxygen side of the carbon monoxide molecule collides with the oxygen molecule. In the second case, the carbon side of the carbon monoxide molecule collides with the oxygen molecule. The second case is clearly more likely to result in the formation of carbon dioxide, which has a central carbon atom bonded to two oxygen atoms (O=C=O). This is a rather simple example of how important the orientation of the collision is in terms of creating the desired product of the reaction.
Activation Energy
If the collision does take place with the correct orientation, there is still no guarantee that the reaction will proceed to form carbon dioxide. In addition to a proper orientation, the collision must also occur with sufficient energy to result in product formation. The minimum energy necessary to form a product during a collision between reactants is called the activation energy (Ea). The energy of the molecular collisions come from the kinetic energy of the reactant molecules. If the kinetic energy of the reactant molecules is low, then most collisions will not result in a reaction and the overall reaction will occur slowly if at all. Only the fastest moving molecules may have enough kinetic energy to react. If most reactant molecules have high kinetic energy, then most collisions will be sufficiently energetic for reaction and the overall reaction will proceed quickly. Because temperature is a measure of the average kinetic energy of particles in a substance, reactions tend to occur more quickly at higher than lower temperatures. Not only does the energy of collision increase with temperature but so does the frequency of collisions. More frequent and more energetic collisions mean faster reaction rate.
When reactant species collide with both proper orientation and adequate energy, they combine to form an unstable species called an activated complex or a transition state. These species are very short lived and usually undetectable by most analytical instruments. In some cases, sophisticated spectral measurements have been used to observe transition states.
Collision theory explains why most reaction rates increase as concentrations, or surface area in the case of solid reactants, increase. With an increase in the concentration or surface area of any reacting substance, the chances for collisions between molecules are increased because there are more molecules per unit of volume.
Potential energy (or energy level) diagrams are widely used in chemical kinetics to illustrate various properties of the reaction of interest (Figure 2). Viewing the diagram from left to right, the system initially comprises reactants only, A + B. Reactant molecules with sufficient energy can collide to form a high-energy activated complex or transition state. The unstable transition state can then subsequently decay to yield stable products, C + D. The diagram depicts the reaction’s activation energy, Ea, as the energy difference between the reactants and the transition state. The change in enthalpy of the reaction, ΔH, is the energy difference between the reactants and products. The reaction is
- exothermic (ΔH < 0) when there is a decrease in energy from reactants to product.
- endothermic (ΔH > 0) when there is an increase in energy from reactants to products.

Arrhenius Equation
The Arrhenius equation relates the activation energy and the rate constant, k, for many chemical reactions:
Equation 1
[latex]k=Ae^{\frac{-E_\text{a}}{RT}}[/latex]
- [latex]k[/latex], rate constant (variable units)
- [latex]A[/latex], pre-exponential factor or frequency factor, which is related to the frequency of collisions and the orientation of the reacting molecules (same units as [latex]k[/latex])
- [latex]e[/latex], the irrational constant 2.7183
- [latex]E_{\text{a}}[/latex], activation energy ([latex]\text{J/mol}[/latex])
- [latex]R[/latex], gas constant ([latex]8.314\text{ }\frac{\text{J}}{\text{mol}\cdot\text{K}}[/latex])
- [latex]T[/latex], kelvin or absolute temperature
Postulates of collision theory are nicely accommodated by the Arrhenius equation. The frequency factor reflects how well the reaction conditions favor properly oriented collisions between reactant molecules. An increased probability of effectively oriented collisions results in larger values for A and faster reaction rates.
The exponential term, [latex]e^{\frac{−E_\text{a}}{RT}}[/latex], describes the effect of activation energy on reaction rate. According to kinetic-molecular theory (Section 1.3), the temperature of matter is a measure of the average kinetic energy of its constituent atoms or molecules. The distribution of energies among the molecules composing a sample of matter at any given temperature is described by the plot shown in Figure 3(a). Two shaded areas under the curve represent the numbers of molecules possessing adequate energy (RT) to overcome the activation barriers (Ea). A lower activation energy results in a greater fraction of adequately energized molecules and a faster reaction.
The exponential term also describes the effect of temperature on reaction rate. A higher temperature represents a correspondingly greater fraction of molecules possessing sufficient energy (RT) to overcome the activation barrier (Ea), as shown in Figure 3(b). This yields a greater value for the rate constant and a correspondingly faster reaction rate.
 Figure 3 Molecular energy distributions showing numbers of molecules with energies exceeding (a) two different activation energies at a given temperature, and (b) a given activation energy at two different temperatures. Source: OpenStax Chemistry 2e
Equation 1 can be linearized as
Equation 2
[latex]\ln k = \frac{-E_\text{a}}{R}\frac{1}{T}+\ln A[/latex]
- [latex]k[/latex], rate constant (variable units)
- [latex]E_{\text{a}}[/latex], activation energy ([latex]\text{J/mol}[/latex])
- [latex]R[/latex], gas constant ([latex]8.314\text{ }\frac{\text{J}}{\text{mol}\cdot\text{K}}[/latex])
- [latex]T[/latex], kelvin or absolute temperature
- [latex]A[/latex], pre-exponential factor or frequency factor, which is related to the frequency of collisions and the orientation of the reacting molecules (same units as [latex]k[/latex])
Equation 2 can be plotted as [latex]\ln k[/latex] versus [latex]\frac{1}{T}[/latex] to obtain a straight line graph with slope [latex]\frac{−E_\text{a}}{R}[/latex] and a y-intercept (vertical intercept) of [latex]\ln A[/latex] as illustrated in Figure 4.
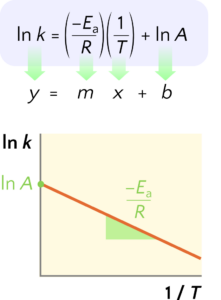
Figure 4 The linearized form of the Arrhenius equation produces a straight line when the natural logarithm of the rate constant k is plotted against the reciprocal of the absolute temperature. The slope is the negative of activation energy divided by the gas constant, and the vertical intercept is the natural logarithm of the pre-exponential factor of the Arrhenius equation. Source: Jung-Lynn Jonathan Yang
A convenient approach for determining [latex]E_\text{a}[/latex] for a reaction involves the measurement of k at two or more different temperatures. By subtracting two points (1/T1, k1) and (1/T2, k2) on the line of ln k versus 1/T, we obtain the equation
Equation 3
[latex]\ln\left(\frac{k_2}{k_1}\right) = \frac{−E_\text{a}}{R}\left(\frac{1}{T_2}−\frac{1}{T_1}\right)[/latex]
- [latex]k[/latex], rate constant (variable units)
- [latex]E_{\text{a}}[/latex], activation energy ([latex]\text{J/mol}[/latex])
- [latex]R[/latex], gas constant ([latex]8.314\text{ }\frac{\text{J}}{\text{mol}\cdot\text{K}}[/latex])
- [latex]T[/latex], kelvin or absolute temperature
Example 1
Determination of Ea
The variation of the rate constant with temperature for the decomposition of HI(g) to H2(g) and I2(g) is given here. What is the activation energy for the reaction?
| T (K) | k (L/mol/s) |
|---|---|
| 555 | 3.52 × 10⁻⁷ |
| 575 | 1.22 × 10⁻⁶ |
| 645 | 8.59 × 10⁻⁵ |
| 700 | 1.16 × 10⁻³ |
| 781 | 3.95 × 10⁻² |
SOLUTION
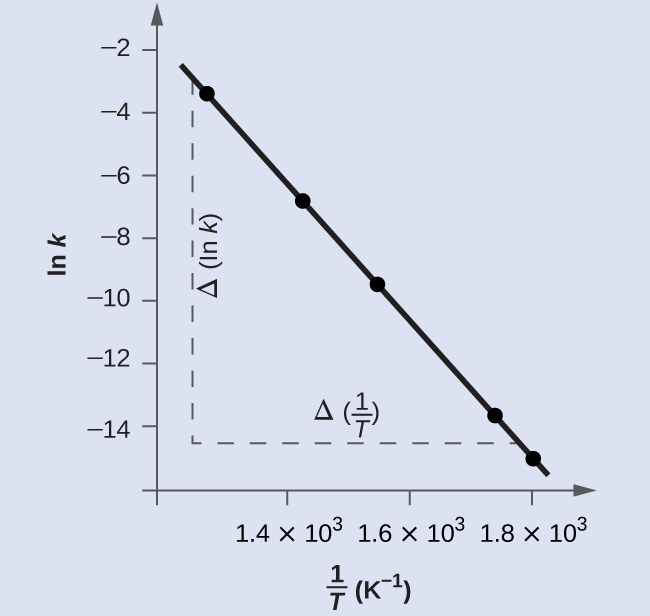
Values of [latex]\frac{1}{T}[/latex] and ln k are:
| [latex]\frac{1}{T}\;(K^{-1})[/latex] | ln k |
|---|---|
| 1.80 × 10⁻³ | −14.860 |
| 1.74 × 10⁻³ | −13.617 |
| 1.55 × 10⁻³ | −9.362 |
| 1.43 × 10⁻³ | −6.759 |
| 1.28 × 10⁻³ | −3.231 |
Figure 5 is a graph of ln k versus [latex]\frac{1}{T}[/latex]. To determine the slope of the line, we need two values of ln k, which are determined from the line at two values of [latex]\frac{1}{T}[/latex] (one near each end of the line is preferable). For example, the value of ln k determined from the line when [latex]\frac{1}{T} = 1.25\;\times\;10^{-3}[/latex] is −2.593; the value when [latex]\frac{1}{T} = 1.78\;\times\;10^{-3}[/latex] is −14.447.
The slope of this line is given by the following expression:
Thus:
In many situations, it is possible to obtain a reasonable estimate of the activation energy without going through the entire process of constructing the Arrhenius plot. The Arrhenius equation:
can be rearranged as shown to give:
or
This equation can be rearranged to give a one-step calculation to obtain an estimate for the activation energy:
Using the experimental data presented here, we can simply select two data entries. For this example, we select the first entry and the last entry:
| T (K) | k (L/mol/s) | [latex]\frac{1}{T}\;(\text{K}^{-1})[/latex] | ln k |
|---|---|---|---|
| 555 | 3.52 × 10⁻⁷ | 1.80 × 10⁻³ | −14.860 |
| 781 | 3.95 × 10⁻² | 1.28 × 10⁻³ | −3.231 |
After calculating [latex]\frac{1}{T}[/latex] and ln k, we can substitute into the equation:
and the result is Ea = 185,900 J/mol.
This method is very effective, especially when a limited number of temperature-dependent rate constants are available for the reaction of interest.
Example 2
Determination of A
The rate constant at 50.0 °C for a reaction is 0.888 M/s, and the activation energy is 168 kJ/mol. Determine the frequency factor for the reaction.
SOLUTION
Either Equation 1 or Equation 2 can be used. We can isolate [latex]A[/latex] by multiplying both sides of Equation 1 by [latex]e^{\frac{E_\text{a}}{RT}}[/latex].
[latex]k=Ae^{\frac{-E_\text{a}}{RT}} \Rightarrow A = ke^{\frac{E_\text{a}}{RT}}[/latex]
[latex]A = ke^{\frac{E_\text{a}}{RT}} = (0.888 \text{ M/s})e^{\frac{{168\times 10^3 \text{ J/mol}}}{{\left(8.314\frac{\text{ J}}{\text{mol}\cdot \text{K}}\right)(50.0 + 273.15)\text{K}}}} = 1.27 \times 10^{27} \text{ M/s}[/latex]
Optional Resource
Optional Activity
PhET Reactions & Rates Interactive
Chemical reactions occur when molecules collide with each other and undergo a chemical transformation. Before physically performing a reaction in a laboratory, scientists can use molecular modeling simulations to predict how the parameters discussed earlier will influence the rate of a reaction. Using the “angled shot” option, try launching the A atom with varying angles, but with more Total energy than the transition state. What happens when the A atom hits the BC molecule from different directions? Why?
Click to see answer
The A atom has enough energy to react with BC; however, the different angles at which it bounces off of BC without reacting indicate that the orientation of the molecule is an important part of the reaction kinetics and determines whether a reaction will occur.
Find the activation energy (in kJ/mol) of the reaction if the rate constant at 600 K is 3.6 M-1 s-1 and 32.0 M-1 s-1 at 750 K.
Click to see answer
[latex]\begin{align*} \ln\left(\frac{k_2}{k_1}\right)&=-\left(\frac{E_\text{a}}{R}\right)\left(\frac{1}{T_2}-\frac{1}{T_1}\right) \\ \Leftrightarrow -\left(\frac{E_\text{a}}{R}\right)&=\dfrac{\ln\left(\frac{k_2}{k_1}\right)}{\frac{1}{T_2}-\frac{1}{T_1}} \\ \Leftrightarrow E_\text{a}&=-\dfrac{\ln\left(\frac{k_2}{k_1}\right)}{\frac{1}{T_2}-\frac{1}{T_1}}\cdot R \\ &=\dfrac{\ln\left(\frac{3.6\text{ M}^{-1}\text{ s}^{-1}}{32.0\text{ M}^{-1}\text{ s}^{-1}}\right)} {\frac{1}{600\text{ K}}-\frac{1}{750\text{ K}}}\cdot \left(8.314 \text{ J}\cdot\text{mol}^{-1}\cdot\text{K}^{-1}\right)\\ &=5.45\times10^4 \frac{\text{J}}{\text{mol}}=\boxed{54.5\frac{\text{kJ}}{\text{mol}}} \end{align*}[/latex]
