Unit 4 Acid-Base and Solubility Equilibria
4.5 Acid-Base Titrations
OpenStax
Section Learning Objectives
- Interpret titration curves for strong and weak acid-base systems.
- Compute sample pH at important stages of a titration.
- Explain the function of acid-base indicators.
✓ SECTION 4.5 CHECKLIST
| Learning Activity | Graded? | Estimated Time |
|---|---|---|
| Make notes about this section’s reading portion. | No | 60 min |
| Optional Resource: Watch the video about using turmeric as a pH indicator. | No | 3 min |
| Optional Activity: Perform a virtual titration. | No | 60 min |
| Work on the self-check question. | No | 10 min |
| Work on practice exercises. | No | 30 min |
📖 READING PORTION
Determining Solution Concentration by Acid-Base Titration
Titration is an experimental technique to determine an unknown property about a substance, such as the concentration of a solution. Let us consider using sodium hydroxide (NaOH) to titrate a sample of hydrochloric acid (HCl) of unknown concentration. The titrant NaOH(aq) is a standardized solution, meaning a solution of known concentration. The buret (sometimes spelled burette) is a glass cylinder for dispensing the titrant by turning a valve called a stopcock. The buret is secured to a buret clamp attached to a retort stand. An Erlenmeyer flask contains a specific volume of the HCl sample, to which a pH indicator is added to monitor visually the pH of the sample over the course of the titration. Figure 1(a) shows the setup of a titration experiment.
The information collected from titration is the volume of titrant added to the sample to reach the endpoint, when the pH indicator changes colour. The indicator bromothymol blue is yellow in the acidic HCl solution (Figure 1(b)) and becomes green-blue (Figure 1(c)) when the pH increases as all the HCl in the sample reacts with the titrant NaOH. The graduations on the buret indicate the initial volume (Vi) and final volume (Vf) of titrant to calculate how much titrant was added to the sample, where the volume added equals the difference Vf – Vi. Multiplying the known concentration and volume of NaOH(aq) used in the titration gives the moles of NaOH added and is equal to the moles of HCl in the sample because HCl and NaOH react in a 1:1 mole ratio. Dividing the moles of HCl by the volume of the sample gives the concentration of HCl.
Titration Curves
A titration curve is a plot of some solution property versus the amount of added titrant. For acid-base titrations, solution pH is a useful property to monitor because it varies predictably with the solution composition and, therefore, may be used to monitor the titration’s progress and detect its equivalence point. Equivalence point is reached when all of the acid has just been neutralized by the added strong base (or all of the base has just been neutralized by the added strong acid) determined from a titration curve obtained by measuring pH against volume of strong base (or strong acid) added.
The following example exercise demonstrates the computation of pH for a titration solution after additions of several specified titrant volumes. The first example involves a strong acid titration that requires only stoichiometric calculations to derive the solution pH. The second example addresses a weak acid titration requiring equilibrium calculations.
Example 1
Calculating pH for Titration Solutions: Strong Acid/Strong Base
A titration is carried out for 25.00 mL of 0.100 M HCl (strong acid) with 0.100 M of a strong base NaOH (the titration curve is shown in Figure 2). Calculate the pH at these volumes of added base solution:
(a) 0.00 mL
(b) 12.50 mL
(c) 25.00 mL
(d) 37.50 mL
SOLUTION
(a) Titrant volume = 0 mL. The solution pH is due to the acid ionization of HCl. Because this is a strong acid, the ionization is complete and the hydronium ion molarity is 0.100 M. The pH of the solution is then
pH = −log(0.100) = [latex]\boxed{1.000}[/latex]
(b) Titrant volume = 12.50 mL. Since the acid sample and the base titrant are both monoprotic and equally concentrated, this titrant addition involves less than a stoichiometric amount of base, and so it is completely consumed by reaction with the excess acid in the sample. The concentration of acid remaining is computed by subtracting the consumed amount from the initial amount and then dividing by the solution volume
[latex][\text{H}_3\text{O}^+]=\frac{n_{\text{H}_3\text{O}^+}}{V}=\frac{25.00 \text{ mL}×\left(\frac{0.100 \text{ mol}}{1 \text{ L}}\right)−0.100\text{ M}×12.50\text{ mL}}{25.00\text{ mL }+12.50\text{ mL}}=0.0333\text{ M}[/latex]
[latex]\text{pH} = -\log[\text{H}_3\text{O}^+]=-\log(0.0333)=\boxed{1.477}[/latex]
(c) Titrant volume = 25.00 mL. This titrant addition involves a stoichiometric amount of base (the equivalence point), and so only products of the neutralization reaction are in solution (water and NaCl). Neither the cation nor the anion of this salt undergo acid-base ionization; the only process generating hydronium ions is the autoionization of water. The solution is neutral, having a pH = [latex]\boxed{7.00}[/latex].
(d) Titrant volume = 37.50 mL. This involves the addition of titrant in excess of the equivalence point. The solution pH is then calculated using the concentration of hydroxide ion
[latex][\text{OH}^−]=\frac{n_{\text{OH}^−}}{V}=\frac{0.100\text{ M}×37.50\text{ mL }−25.00 \text{ mL}×\frac{0.100\text{ mol}}{1\text{ L}}}{25.00\text{ mL}+37.50\text{ mL}}=0.0200\text{ M}[/latex]
[latex]\text{pH} = 14 − \text{pOH} = 14 + \log[\text{OH}^−] = 14 + \log(0.0200) = \boxed{12.30}[/latex]
Example 2
Titration of a Weak Acid with a Strong Base
Consider the titration of 25.00 mL of 0.100 M CH3COOH with 0.100 M NaOH. The reaction can be represented as:
CH3COOH + OH− ⟶ CH3COO− + H2O
Calculate the pH of the titration solution after the addition of the following volumes of NaOH titrant:
(a) 0.00 mL
(b) 25.00 mL
(c) 12.50 mL
(d) 37.50 mL
SOLUTION
(a) The initial pH is computed for the acetic acid solution in the usual ICE approach:
[latex]K_{\text{a}}=\frac{[\text{H}_3\text{O}^+][\text{CH}_3\text{COO}^−]}{[\text{CH}_3\text{COOH}]}≈\frac{[ \text{H}_3\text{O}^+]^2}{[\text{CH}_3\text{COOH}]_0}[/latex], and [latex][\text{H}_3\text{O}^+]=\sqrt{K_{\text{a}}×[\text{CH}_3\text{COOH}]}=\sqrt{1.8×10^{−5}×0.100}=1.3×10^{−3}\text{ M}[/latex]
[latex]\text{pH}=−\log(1.3×10^{−3})=\boxed{2.87}[/latex]
(b) The acid and titrant are both monoprotic and the sample and titrant solutions are equally concentrated; thus, this volume of titrant represents the equivalence point. Unlike the strong-acid example above, however, the reaction mixture in this case contains a weak conjugate base (acetate ion). The solution pH is computed considering the base ionization of acetate, which is present at a concentration of
0.00250 mol / 0.0500 L = 0.0500 M CH3COO−
Base ionization of acetate is represented by the equation
CH3COO−(aq) + H2O(l) ⇌ CH3COOH(aq) + OH−(aq)
[latex]K_{\text{b}}=\frac{[\text{H}_3\text{O}^+][\text{OH}^−]}{K_{\text{a}}}=\frac{K_{\text{w}}}{K_{\text{a}}}=\frac{1.0×10^{−14}}{1.8×10^{−5}}=5.6×10^{−10}[/latex]
Assuming x << 0.0500, the pH may be calculated via the usual ICE approach
[latex]K_{\text{b}}=\frac{x^2}{0.0500}[/latex]
[latex]x=[\text{OH}^−]=5.3×10^{−6} \text{ M}[/latex]
[latex]\text{pOH}=−\log(5.3×10^{−6})=5.28[/latex]
[latex]\text{pH}=14.00−5.28=\boxed{8.72}[/latex]
Note that the pH at the equivalence point of this titration is significantly greater than 7, as expected when titrating a weak acid with a strong base.
(c) Titrant volume = 12.50 mL. This volume represents one-half of the stoichiometric amount of titrant, and so one-half of the acetic acid has been neutralized to yield an equivalent amount of acetate ion. The concentrations of these conjugate acid-base partners, therefore, are equal. A convenient approach to computing the pH is use of the Henderson-Hasselbalch equation
[latex]\text{pH}=\text{p}K_{\text{a}}+\log\frac{[\text{Base}]}{[\text{Acid}]}=−\log(K_{\text{a}})+\log\frac{[\text{CH}_3\text{COO}^−]}{[\text{CH}_3\text{COOH}]}=−\log(1.8×10^{−5})+\log(1)[/latex]
[latex]\text{pH}=−\log(1.8×10^{−5})=\boxed{4.74}[/latex]
(Note that pH = pKa at the half-equivalence point in a titration of a weak acid.)
(d) Titrant volume = 37.50 mL. This volume represents a stoichiometric excess of titrant, and a reaction solution containing both the titration product, acetate ion, and the excess strong titrant. In such solutions, the solution pH is determined primarily by the amount of excess strong base
[latex][\text{OH}^−]=\frac{(0.003750 \text{ mol}−0.00250 \text{ mol})}{0.06250\text{ L}}=2.00×10^{−2} \text{ M}[/latex]
[latex]\text{pOH}=−\log(2.00×10^{−2})=1.70[/latex]
[latex]\text{pH}=14.00−1.70=\boxed{12.30}[/latex]
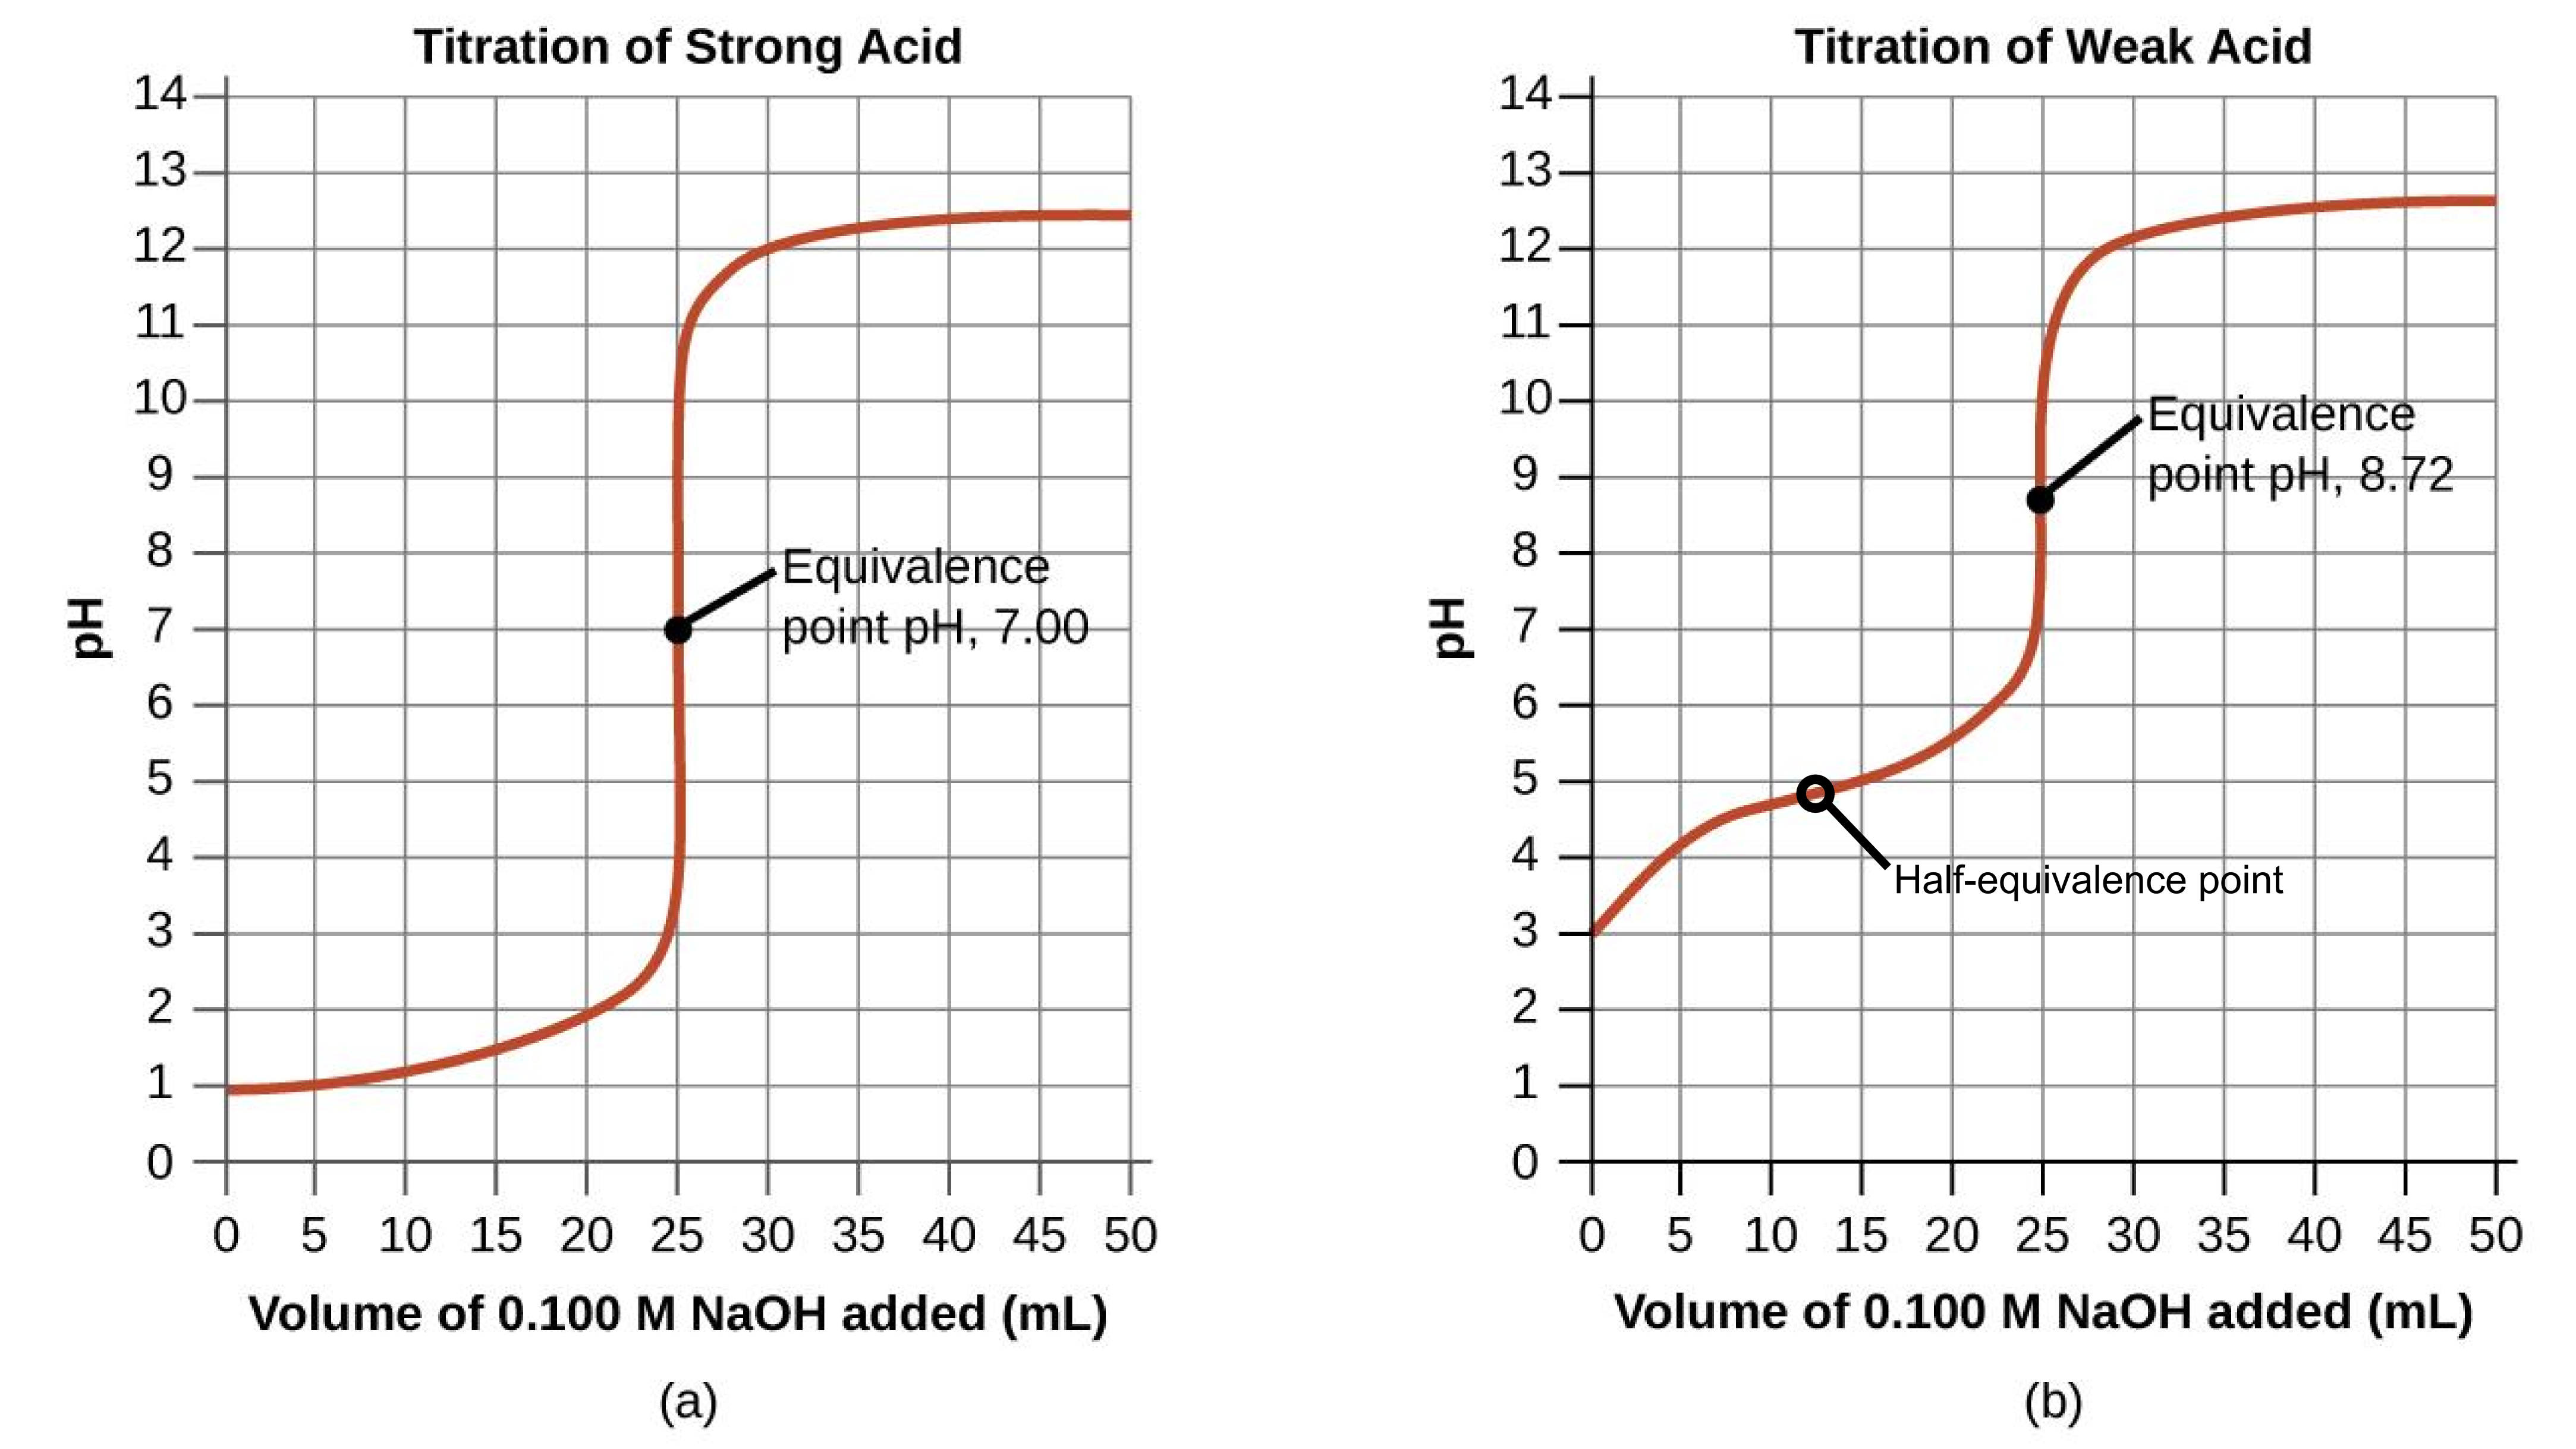
Performing additional calculations similar to those in the preceding example permits a more full assessment of titration curves. A summary of pH/volume data pairs for the strong and weak acid titrations is provided in Table 1 and plotted as titration curves in Figure 2. A comparison of these two curves illustrates several important concepts that are best addressed by identifying the four stages of a titration:
- Initial state (added titrant volume = 0 mL). pH is determined by the acid being titrated; because the two acid samples are equally concentrated, the weak acid will exhibit a greater initial pH.
- Pre-equivalence point (0 mL < V < 25 mL). Solution pH increases gradually and the acid is consumed by reaction with added titrant; composition includes unreacted acid and the reaction product, its conjugate base. Weak acids and weak bases have a buffering region, where the pH is relatively steady. The half-equivalence point is a specific point in the middle of the buffering region such that half of the monoprotic weak acid or weak base has been neutralized, Figure 2(b). The titration curves for strong acids or strong bases have neither a buffering region nor a half-equivalence point, Figure 2(a).
- Equivalence point (V = 25 mL). A drastic rise in pH is observed as the solution composition transitions from acidic to either neutral (for the strong acid sample) or basic (for the weak acid sample), with pH determined by ionization of the conjugate base of the acid.
- Post–equivalence point, also called overshoot (V > 25 mL). pH is determined by the amount of excess strong base titrant added; since both samples are titrated with the same titrant, both titration curves appear similar at this stage.
|
Volume of 0.100 M NaOH Added (mL) |
Moles of NaOH Added |
pH Values 0.100 M HCl |
pH Values 0.100 M CH3CO2H |
|
0.0 |
0.0 |
1.00 |
2.87 |
|
5.0 |
0.00050 |
1.18 |
4.14 |
|
10.0 |
0.00100 |
1.37 |
4.57 |
|
15.0 |
0.00150 |
1.60 |
4.92 |
|
20.0 |
0.00200 |
1.95 |
5.35 |
|
22.0 |
0.00220 |
2.20 |
5.61 |
|
24.0 |
0.00240 |
2.69 |
6.13 |
|
24.5 |
0.00245 |
3.00 |
6.44 |
|
24.9 |
0.00249 |
3.70 |
7.14 |
|
25.0 |
0.00250 |
7.00 |
8.72 |
|
25.1 |
0.00251 |
10.30 |
10.30 |
|
25.5 |
0.00255 |
11.00 |
11.00 |
|
26.0 |
0.00260 |
11.29 |
11.29 |
|
28.0 |
0.00280 |
11.75 |
11.75 |
|
30.0 |
0.00300 |
11.96 |
11.96 |
|
35.0 |
0.00350 |
12.22 |
12.22 |
|
40.0 |
0.00400 |
12.36 |
12.36 |
|
45.0 |
0.00450 |
12.46 |
12.46 |
|
50.0 |
0.00500 |
12.52 |
12.52 |
Table 1 pH Values in the Titrations of a Strong Acid and of a Weak Acid.
Acid-Base Indicators
Certain organic substances change colour in dilute solution when the hydronium ion concentration reaches a particular value. For example, phenolphthalein is a colourless substance in any aqueous solution with a hydronium ion concentration greater than 5.0 × 10⁻⁹ M (pH < 8.3). In more basic solutions where the hydronium ion concentration is less than 5.0 × 10⁻⁹ M (pH > 8.3), it is red or pink. Substances such as phenolphthalein, which can be used to determine the pH of a solution, are called acid-base indicators. Acid-base indicators are either weak organic acids or weak organic bases.
The equilibrium in a solution of the acid-base indicator methyl orange, a weak acid, can be represented by an equation in which we use HIn as a simple representation for the complex methyl orange molecule.
HIn(aq) red + H2O(l) ⇌ H3O+(aq) + In−(aq) yellow
[latex]K_{\text{a}}=\frac{[\text{H}_3\text{O}^+][\text{In}^−]}{[\text{HIn}]}=4.0×10^{−4}[/latex]
The anion of methyl orange, In−, is yellow, and the nonionized form, HIn, is red. When we add acid to a solution of methyl orange, the increased hydronium ion concentration shifts the equilibrium toward the nonionized red form, in accordance with Le Châtelier’s principle. If we add base, we shift the equilibrium towards the yellow form. This behaviour is completely analogous to the action of buffers.
The perceived colour of an indicator solution is determined by the ratio of the concentrations of the two species In− and HIn. If most of the indicator (typically about 60−90% or more) is present as In−, the perceived colour of the solution is yellow. If most is present as HIn, then the solution colour appears red. The Henderson-Hasselbalch equation is useful for understanding the relationship between the pH of an indicator solution and its composition (thus, perceived colour)
[latex]\text{pH}=\text{p}K_{\text{a}}+\log\frac{[\text{In}^−]}{[\text{HIn}]}[/latex]
In solutions where pH > pKa, the logarithmic term is positive, indicating an excess of the conjugate base form of the indicator (yellow solution). When pH < pKa, the log term is negative, indicating an excess of the conjugate acid (red solution). When the solution pH is close to the indicator pKa, appreciable amounts of both conjugate partners are present, and the solution colour is that of an additive combination of each (yellow and red, yielding orange). The colour change interval (or pH interval) for an acid-base indicator is defined as the range of pH values over which a change in colour is observed, and for most indicators this range is approximately pKa ± 1.
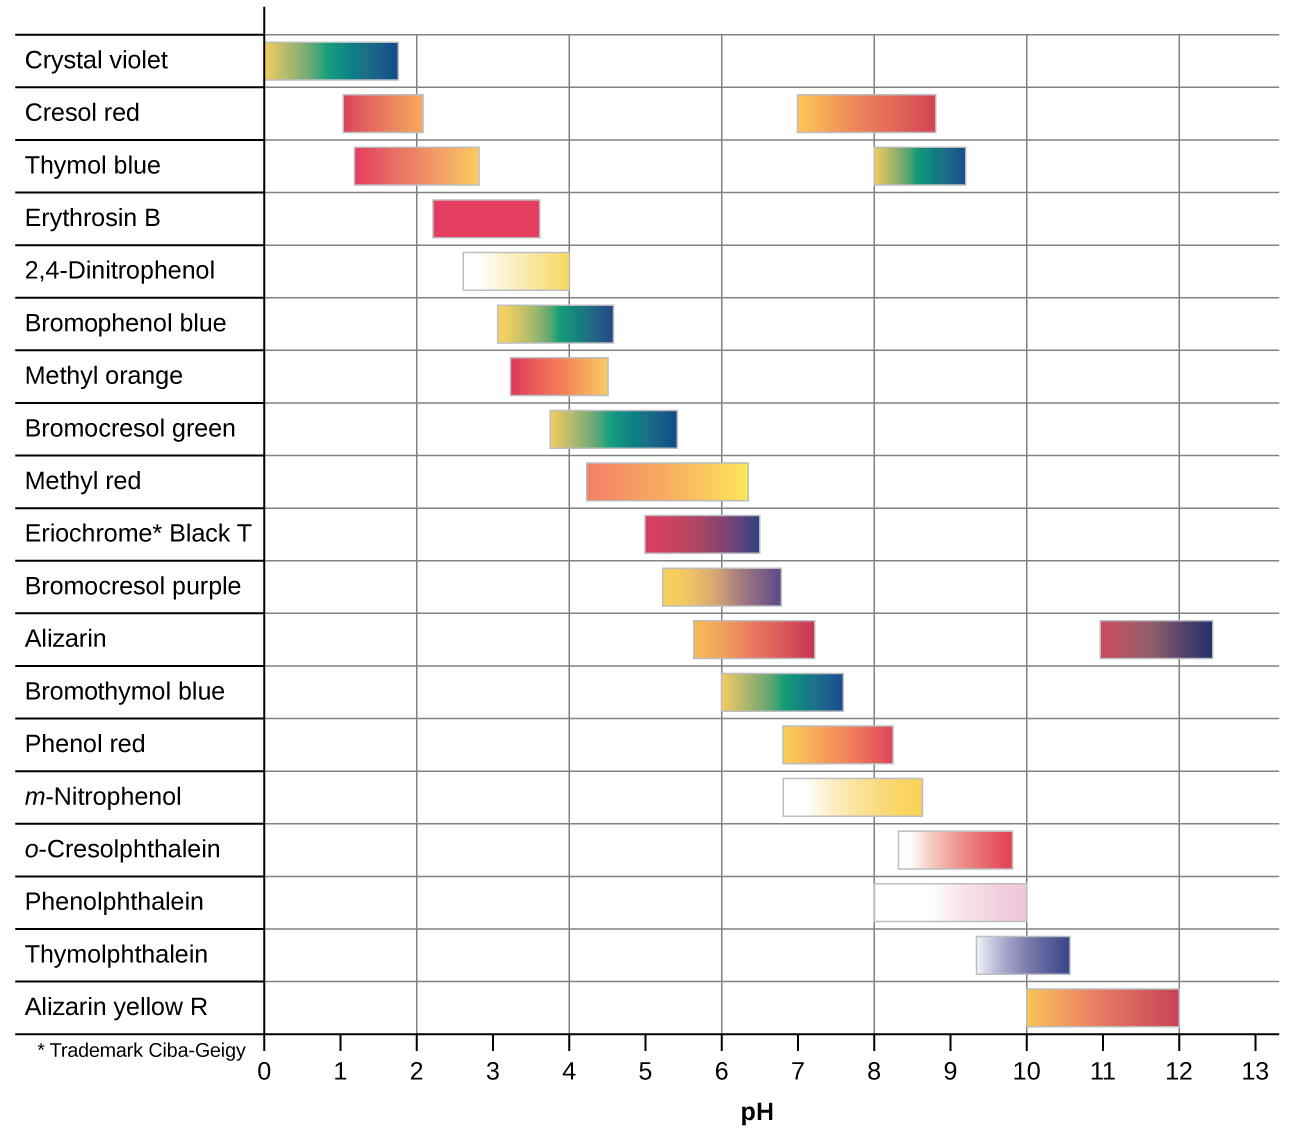
There are many different acid-base indicators that cover a wide range of pH values and can be used to determine the approximate pH of an unknown solution by a process of elimination. Universal indicators and pH paper contain a mixture of indicators and exhibit different colours at different pH’s. Figure 3 presents several indicators, their colours, and their colour-change intervals.
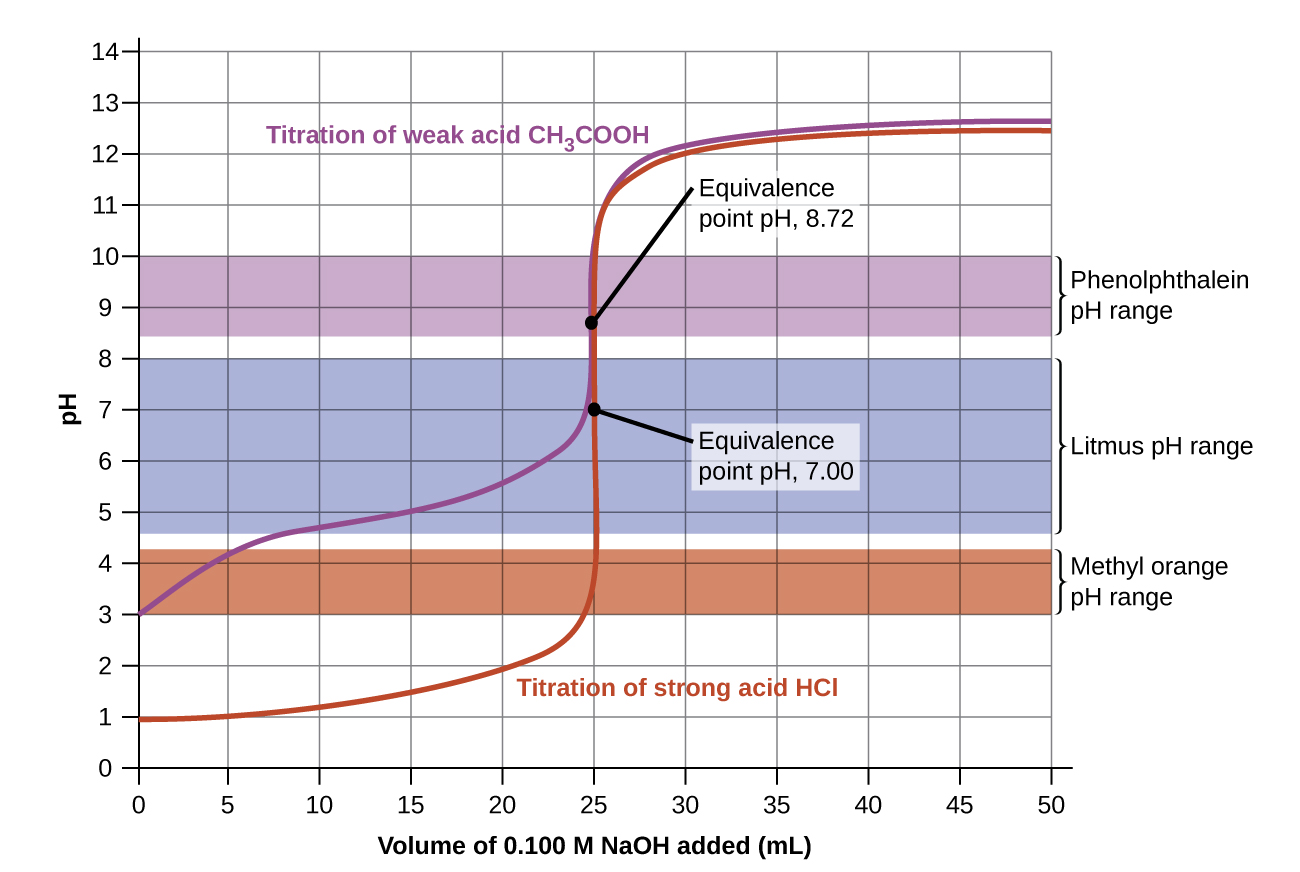
The titration curves shown in Figure 4 illustrate the choice of a suitable indicator for specific titrations. The titration endpoint is reached when the colour of the indicator changes. When using indicators, pH is generally not measured. Ideally, the right indicator will change colour (endpoint) at or very nearly at the equivalence point. In the strong acid titration, use of any of the three indicators should yield reasonably sharp colour changes and accurate endpoint determinations. For the titration of hydrochloric acid with sodium hydroxide, the solution pH reaches the lower limit of the methyl orange colour change interval after addition of ~24 mL of titrant, at which point the initially red solution would begin to appear orange. When 25 mL of titrant has been added (the equivalence point), the pH is well above the upper limit and the solution will appear yellow. The titration’s endpoint may then be estimated as the volume of titrant that yields a distinct orange-to-yellow colour change. This colour change would be challenging for most human eyes to precisely discern. More-accurate estimates of the titration endpoint are possible using either litmus or phenolphthalein, both of which exhibit colour change intervals that are encompassed by the steep rise in pH that occurs around the 25.00 mL equivalence point.
The weak acid titration curve in Figure 4 shows that only one of the three indicators is suitable for endpoint detection. If methyl orange is used in this titration, the solution will undergo a gradual red-to-orange-to-yellow colour change over a relatively large volume interval (0–6 mL), completing the colour change well before the equivalence point (25 mL) has been reached. Use of litmus would show a colour change that begins after adding 7–8 mL of titrant and ends just before the equivalence point. Phenolphthalein, on the other hand, exhibits a colour change interval that nicely brackets the abrupt change in pH occurring at the titration’s equivalence point. A sharp colour change from colourless to pink will be observed within a very small volume interval around the equivalence point.
Example 3
Titrating a Weak Base with a Strong Acid
A 10.00 mL solution of 0.100 M sodium nitrite is titrated with 0.0500 M hydrochloric acid. The nitrite ion has Kb = 2.17 × 10⁻¹¹.
(a) Calculate the pH of the sodium nitrite solution before adding hydrochloric acid.
(b) Calculate the volume of hydrochloric acid needed to reach the half-equivalence point and the half-equivalence point pH.
(c) Calculate the volume of hydrochloric acid needed to reach the equivalence point and the equivalence point pH.
(d) Among the indicators in Figure 3, identify a suitable acid-base indicator for this titration.
SOLUTION
(a) Sodium nitrite is an ionic compound consisting of sodium (Na+) ions, which are pH-neutral in water, and nitrite (NO2−) ions, which can accept protons and thus are basic. The pH of the sodium nitrite solution is
[latex]\begin{align*} K_{\text{b, NO}_2^-}&=\frac{[\text{HNO}_2][\text{OH}^-]}{[\text{NO}_2^-]} \\ 2.17\times10^{-11}&=\frac{x\cdot x}{0.100-x} \approx \frac{x \cdot x}{0.100} \\ x^2&=\left(2.17\times10^{-11}\right)(0.100) \\ x&=\sqrt{\left(2.17\times10^{-11}\right)(0.100)} \\ &=1.47\times 10^{-6} \text{ M} = [\text{OH}^-] \end{align*}[/latex]
[latex]\begin{align*} \text{% ionization}&=\frac{[\text{OH}^-]_{\text{eq}}}{[\text{NO}_2^-]_{\text{initial}}}\times100\% \\ &=\frac{1.47\times 10^{-6} \text{ M}}{0.100 \text{ M}}\times100\% \\ &=1.47\times10^{-3}\% \ll 5\% \end{align*}[/latex]
We can use the small x approximation because the magnitude of x is less than 5% of the initial concentration of base.
[latex]\begin{align*} \text{pOH}&=-\log[\text{OH}^-]=-\log{\left(1.47\times 10^{-6}\right)} = 5.831 \\ \text{pH}&=14.00-\text{pOH}=14.00-5.831 = \boxed{8.17} \end{align*}[/latex]
(b) Hydrochloric acid has hydronium ions and pH-neutral chloride ions. The reaction between hydrochloric acid and sodium nitrite is
[latex]\begin{array}{ll} &\text{H}_3\text{O}^+(aq)\;+\;&\text{NO}_2^-(aq)\;\longrightarrow\;\text{H}_2\text{O}(l)\;+\;\text{HNO}_2(aq) \\ &V=? &10.00 \text{ mL} \\ &0.0500 \text{ M} &0.100 \text{ M} \end{array}[/latex]
At the half-equivalence point, half of the moles of NO2− is neutralized. Hydrochloric acid and sodium nitrite are monoprotic species. We can use half the initial volume of sodium nitrite to mean half of the moles of NO2−. The volume of hydrochloric acid will have enough hydronium ions to neutralize half of the moles of NO2−.
[latex]V_{\text{HCl}}=\frac{1}{2}(10.00 \text{ mL NO}_2^-)\left(\frac{0.100 \text{ mol NO}_2^-}{\text{L NO}_2^-}\right)\left(\frac{1 \text{ mol HCl}}{1 \text{ mol NO}_2^-}\right)\left(\frac{\text{L HCl}}{0.0500 \text{ mol HCl}}\right) =\boxed{10.0 \text{ mL HCl}}[/latex]
The significant species in solution at the half-equivalence point are NO2−, HNO2, Cl−, and water. This is a buffer solution, an equimolar mixture of weak base (NO2−) and weak acid (HNO2) conjugate pairs. Even though the Henderson-Hasselbalch equation has concentration terms in a ratio, we may use the ratio of the moles of NO2− and the moles of HNO2. Both NO2− and HNO2 are in the same volume. The volume factor cancels in the ratio. The moles of NO2− and HNO2 are also the same and cancel. The term [latex]\text{log}(1)[/latex] is zero.
The Ka and pKa of nitrous acid are
[latex]K_{\text{a, HNO}_2}=\frac{K_{\text{w}}}{{K_{\text{b, NO}_2^-}}}=\frac{1.0\times10^{-14}}{2.17\times10^{-11}}=4.6\times10^{-4}[/latex]
[latex]\text{p}K_\text{a}=-\log K_\text{a} = -\log \left(4.6\times10^{-4}\right)=3.34[/latex]
Use the value of pKa in the Henderson-Hasselbalch equation
[latex]\begin{align*} \text{pH}&=\text{p}K_{\text{a}}+\log\frac{[\text{A}^-]}{[\text{HA}]} \\ &=3.34+\log(1) \\ &= 3.34 + 0 \\ &= \boxed{3.34} \end{align*}[/latex]
(c) The volume of hydrochloric acid to reach the equivalence point is twice the volume to reach the half-equivalence point
[latex]V_\text{HCl}=2(10.0\text{ mL})=\boxed{20.0 \text{ mL}}[/latex]
The significant species in solution at the equivalence point are HNO2, Cl−, and water. The weak acid HNO2 reacts with water to regenerate NO2− and H3O+. The concentration of HNO2 is the initial moles of NO2− divided by the total volume of sodium nitrate and added hydrochloric acid
[latex][\text{HNO}_2]=(10.00 \text{ mL NO}_2^-)\left(\frac{0.100 \text{ mol NO}_2^-}{\text{L NO}_2^-}\right)\left(\frac{1 \text{ mol HNO}_2}{1 \text{ mol NO}_2^-}\right) \div (10.00 \text{ mL} + 20.0 \text{ mL})=0.0333 \text{ mol HNO}_2/\text{L}[/latex]

[latex]\begin{align*} K_{\text{a, HNO}_2}&=\frac{[\text{H}_3\text{O}^+][\text{NO}_2^-]}{[\text{HNO}_2]} \\ 4.6\times10^{-4}&=\frac{x\cdot x}{0.0333-x} \\ x^2&=\left(4.6\times10^{-4}\right)(0.0333-x) \\ &= (1.5\times10^{-5})-(4.6\times10^{-4})x \\ 0&=x^2+(4.6\times10^{-4})x-(1.5\times10^{-5})\end{align*}[/latex]
[latex]\begin{align*} x&=\frac{-b\pm\sqrt{b^2-4ac}}{2a} \\ &=\frac{-4.6\times10^{-4}\pm\sqrt{\left(4.6\times10^{-4}\right)^2-4(1)\left(-(1.5\times10^{-5})\right)}}{(2)(1)} \\ &=3.7\times10^{-3} \text{ M}, -4.2\times10^{-3} \text{ M} \\ [\text{H}_3\text{O}^+]&=3.7\times10^{-3} \text{ M} \end{align*}[/latex]
[latex]\begin{align*} \text{% ionization}&=\frac{[\text{H}_3\text{O}^+]_{\text{eq}}}{[\text{HNO}_2]_{\text{initial}}}\times100\% \\ &=\frac{3.7\times10^{-3} \text{ M}}{0.0333 \text{ M}}\times100\% \\ &=11\% > 5\% \end{align*}[/latex]
We cannot use the small x approximation because the magnitude of x is greater than 5% of the initial concentration of acid.
[latex]\text{pH}=-\log[\text{H}_3\text{O}^+]=-\log{\left(3.7\times10^{-3}\right)} = \boxed{2.43}[/latex]
(d) A suitable pH indicator is thymol blue. Before the equivalence point, thymol blue is yellow-orange. At the equivalence point, thymol blue becomes more red-orange.
Notice that the equivalence point pH varies with whether the titration involves a weak acid, weak base, strong acid, or strong base. The reason is because the equivalence point pH depends on the acid-base properties of the neutralization products. For a weak acid-strong base titration, such as acetic acid-sodium hydroxide, the equivalence point pH is greater than 7 because the neutralization of acetic acid yields the acetate ion, which is basic. A strong acid-weak base titration, such as hydrochloric acid-sodium nitrite, the equivalence point pH is less than 7 because the neutralization of the nitrite ion produces the conjugate acid, nitrous acid. For a strong acid-strong base titration, such as hydrochloric acid-sodium hydroxide, the equivalence point pH is 7 because the neutralization products are neutral in water. The equivalence point pH is summarized graphically in Figure 5.
Chemistry in Real Life
Blueberries as pH Indicator
Berries are an important food resource with many uses. We use berries in akutaq (pronounced ah-GOO-duck, ᐊᑯᑐᖅ in Inuktitut), a fluffy mixture of whipped fat with meat. Akutaq can be eaten as a snack or meal and is commonly served during celebrations. A food similar to akutaq is pemmican. Berries are sometimes added to pemmican, which consists of fat and dried meat pressed together. Pemmican is rich in calories and can keep for a long time, ideal for winter or travelling when food is scarce.
The anthocyanin class of pigment molecules are responsible for giving blueberries their characteristic colour. Anthocyanins also produce the vibrant colours of various flowers and fruits. However, the hue is dependent on pH (Figure 6). In acidic solution, anthocyanins in the flavylium ion form appear red. Around neutral pH, the quinonebase form is purple-blue. In basic solution, the quinonebase dianion/chalcone form is green-yellow. The range of colours and pH values below are approximate. Each member of the anthocyanin family has a different combination of substituents at R1 and R2. Sugar molecule(s) are also attached to anthocyanins.
Acid-base titrations use pH indicators that each only has one type of coloured molecule and changes colour within a limited pH range. However, the mixture of anthocyanins in blueberries has the advantage of changing colours across the entire pH range. Indicators that work across the entire pH range are called universal indicators. Therefore, we may use blueberries, especially the juice from blueberry peel, as a universal pH indicator.
Optional Resource
The spice turmeric is an acid-base indicator. Watch how turmeric appears yellow in acidic solution and becomes more orange-red as the solution becomes more basic (2 min 39 s).
Optional Activity
Simulate a titration of three acids using NaOH as the titrant. The acid samples available are 0.10 to 1.00 M hydrochloric acid, acetic acid, and hypochlorous acid. The pH indicators are methyl orange, phenolphthalein, and bromothymol blue. The concentration of the NaOH titrant can be varied from 0.10 to 1.00 M. Observe how the pH and colour of the sample varies by adding NaOH solution. The titrant can be added to the sample in increments of 0.05, 0.10, and 1.00 mL.
What volume of 0.125 M hydrochloric acid would be required to titrate a 30.00 mL solution of ammonia (NH3) with a concentration of 0.106 M to reach the equivalence point?
Click to see answer
[latex]V_{\text{NH}_3}=(30.00 \times 10^{-3} \text{ L NH}_3)\left(\dfrac{0.106 \text{ mol NH}_3}{\text{L NH}_3}\right)\left(\dfrac{\text{L HCl}}{0.125 \text{ mol HCl}}\right)=25.4 \times 10^{-3} \text{ L HCl} = \boxed{25.4 \text{ mL HCl}}[/latex]
Note that the prefix “milli” in mL means × 10−3, hence mL = × 10−3 L.
